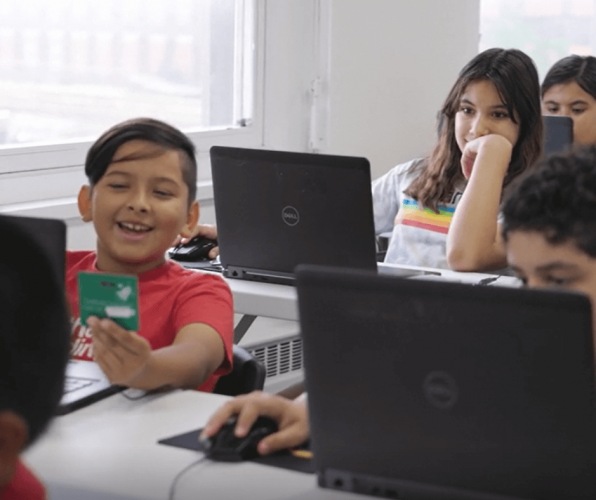

Engage elementary and middle school learners in unprecedented ways and prepare career-ready innovators with STEAM Project-based Learning. With TinkRworks, students learn and apply STEAM concepts to showcase their creativity with personalized STEAM projects. Our hands-on curriculum guides students through the engineering design process—equipping them with essential knowledge and skills.
Bringing STEAM Project-based Learning to your supplemental, afterschool, or summer program has never been simpler! TinkRworks’ versatile STEAM project kits adapt seamlessly to any program and are designed for use across multiple grade levels. Customize your STEAM experience by mixing and matching our make-and-take and reusable kits to meet your budget and academic goals.
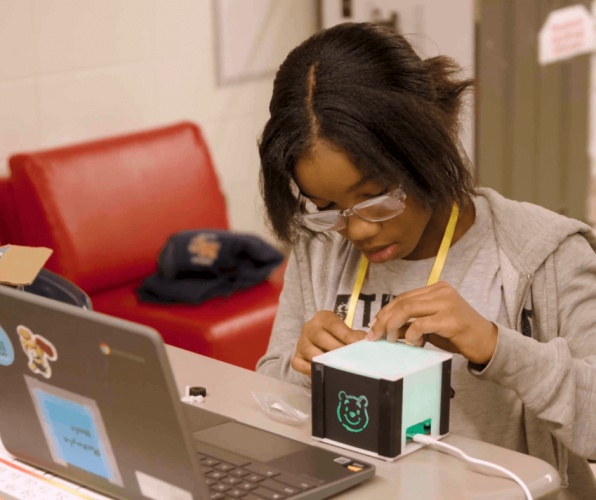
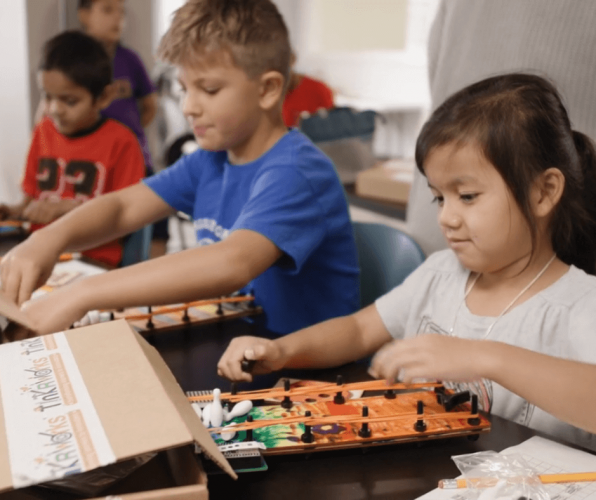
Make-and-Take STEAM Projects: Certain TinkRworks projects are consumable—meaning students receive their very own project kit that they can customize and take home to keep. This means the learning adventure doesn’t end in the classroom. Students can continue to engage with STEAM and bring their ideas to life long after the curriculum is complete.
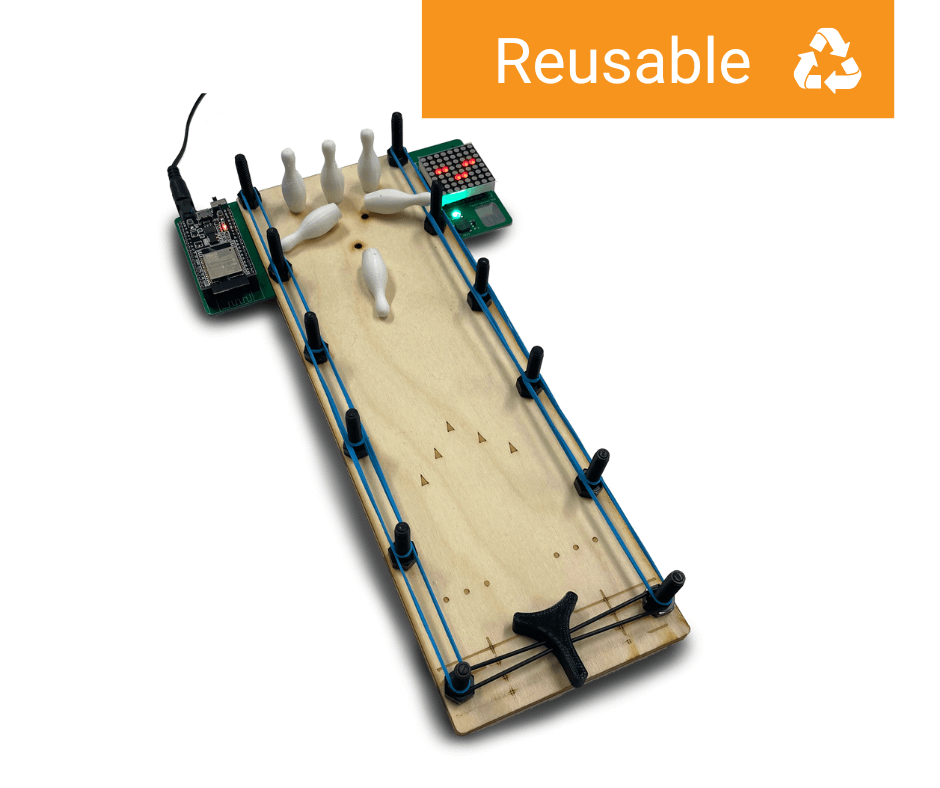
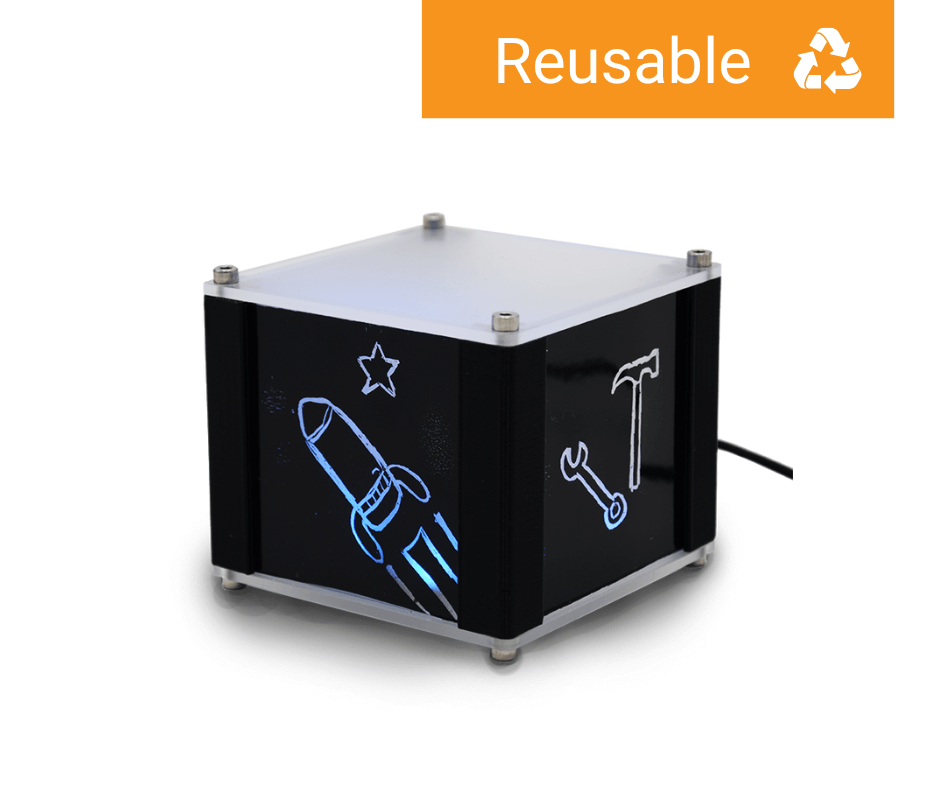
Reusable STEAM Project Kits: Many TinkRworks projects are designed with reusability in mind. Our reusable kits offer the same innovative, comprehensive STEAM instruction as our make-and-take STEAM projects, but they are not limited to one-time use. Reusable STEAM projects can be can implemented with students, disassembled, and used again with another group of students throughout the day or school year—creating endless opportunities to reinforce key concepts.
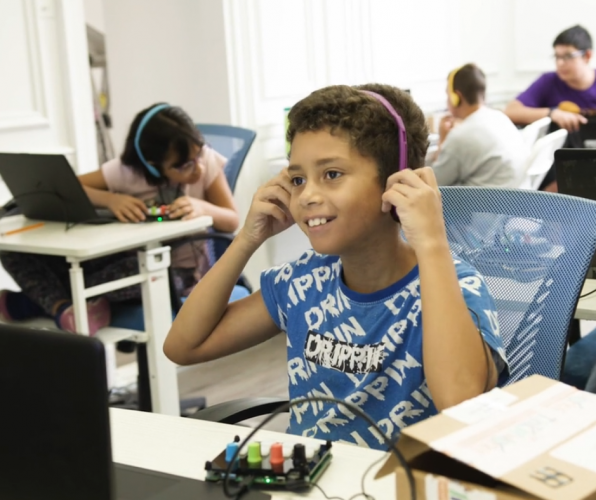
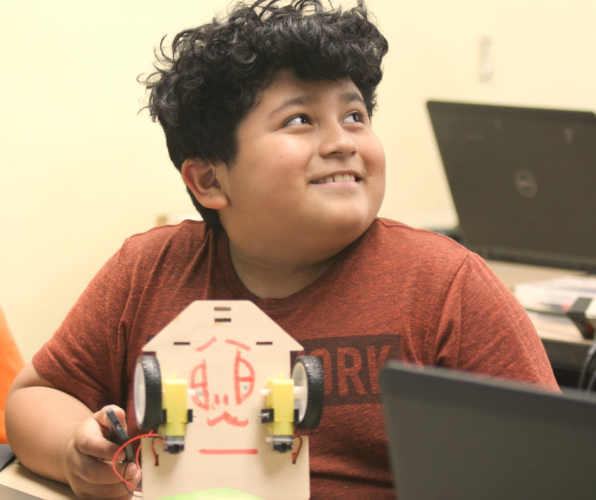
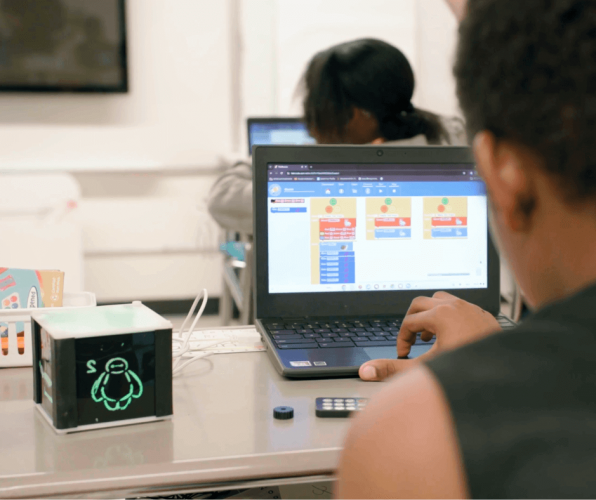
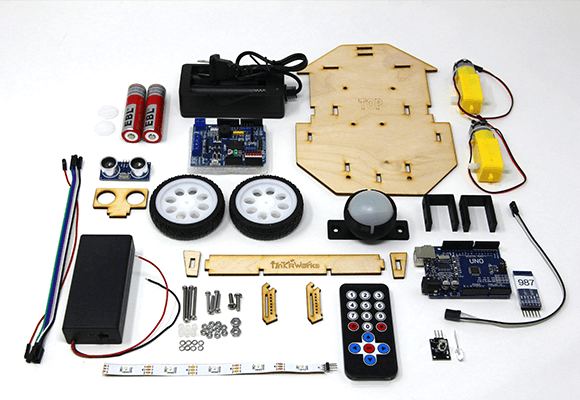
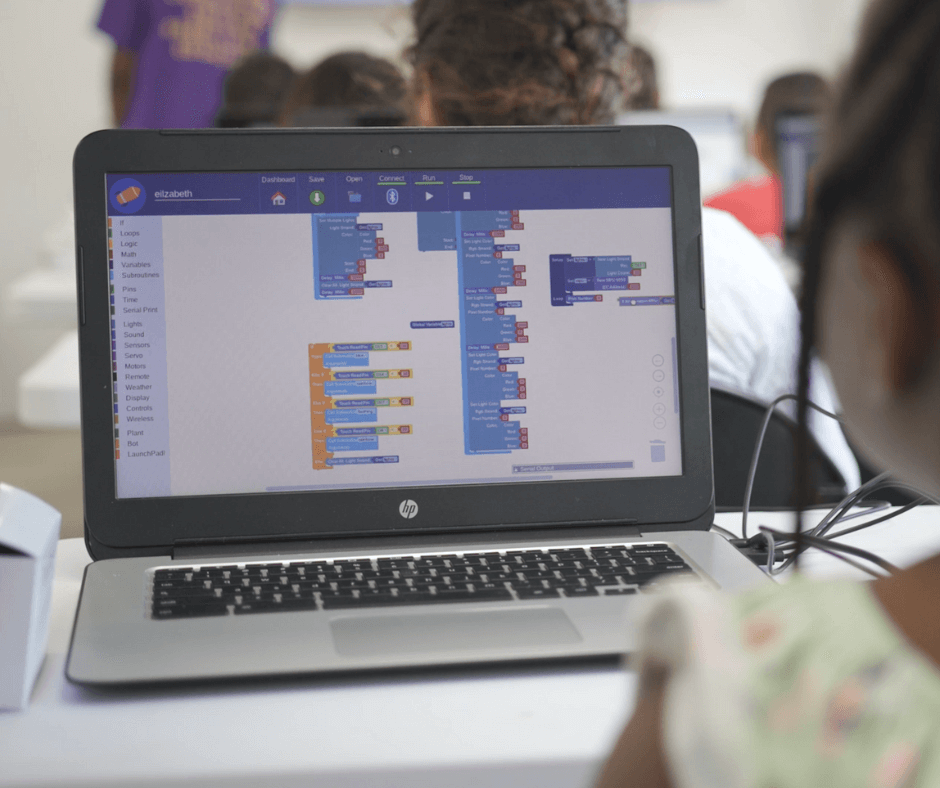
TinkRworks is much more than a robot in a box. Our diverse catalog of STEAM projects empowers students to immerse themselves in the engineering design process as they assemble, wire, decorate, and code innovative creations. From plant science and digital music to art, robotics, and beyond, students explore a wide range of subjects. They don’t just code lights and sounds—they uncover the science behind these concepts, deepening their understanding through engaging, real-world applications.
Hands-on STEAM projects designed to:
Foster a love of creating
Enhance problem-solving skills
Inspire curiosity and self-expression
Reinforce and expand on core concepts
PUSHES, PULLS & PINS
Grades K-2
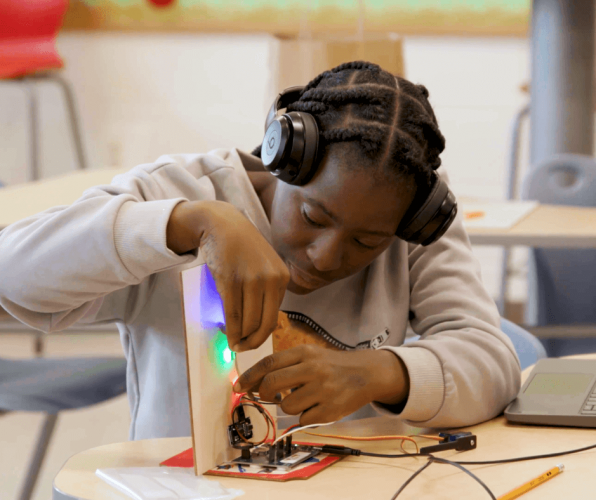
SMART LAMP
Grades 1-2
ART ELECTRIC
Grades 1-8
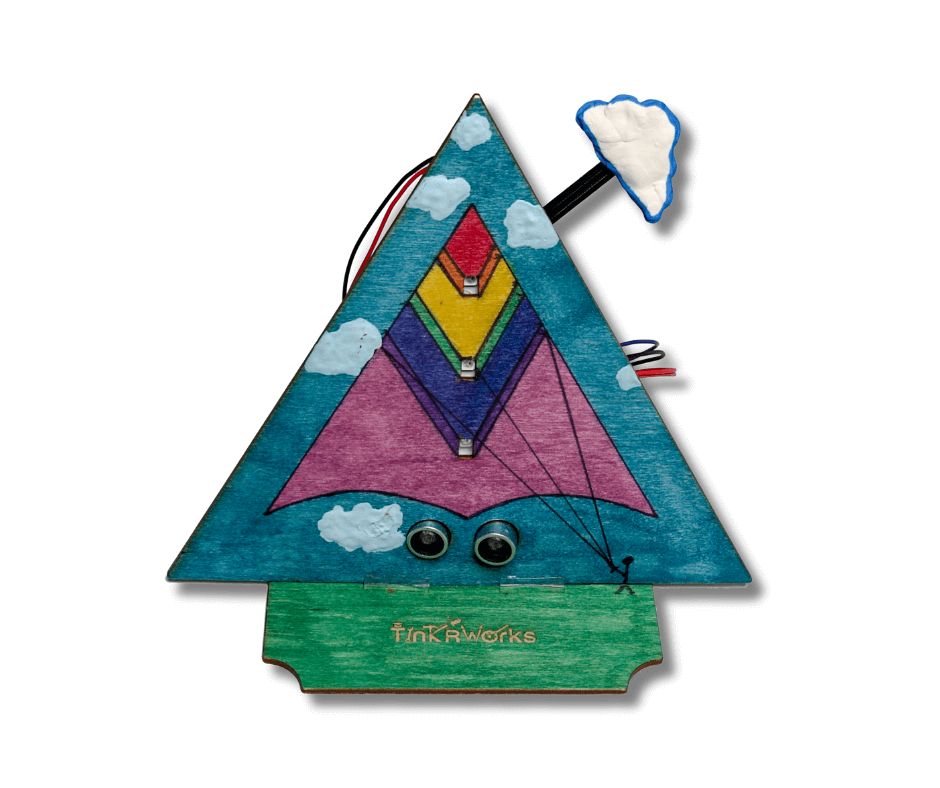
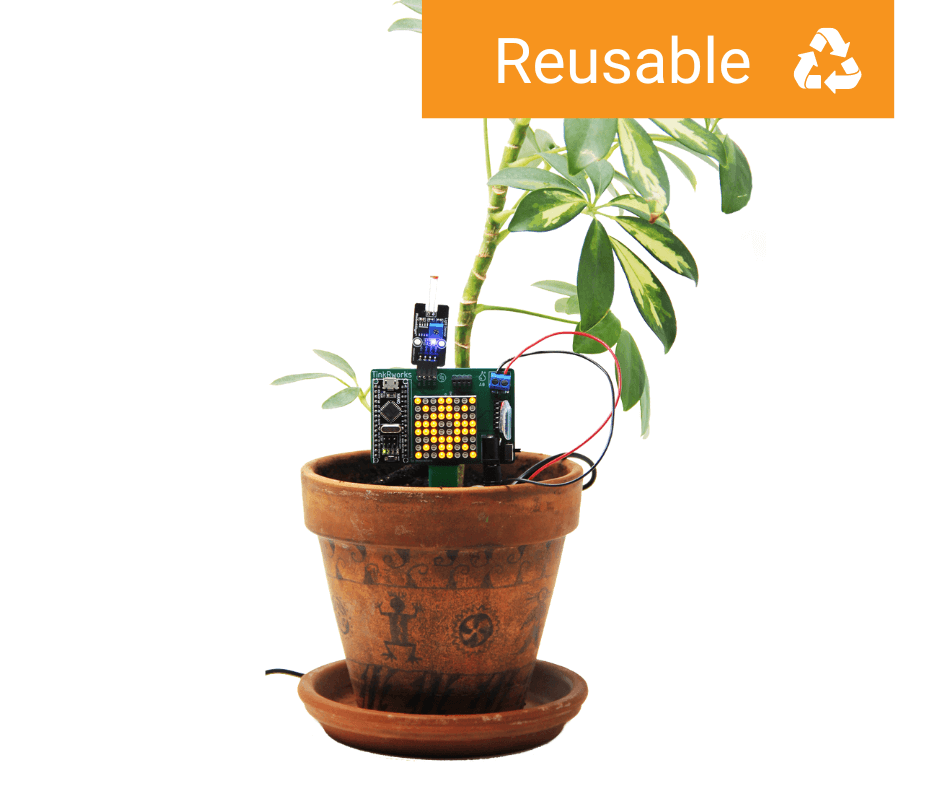
PAMPERED PLANT
Grades 2-5
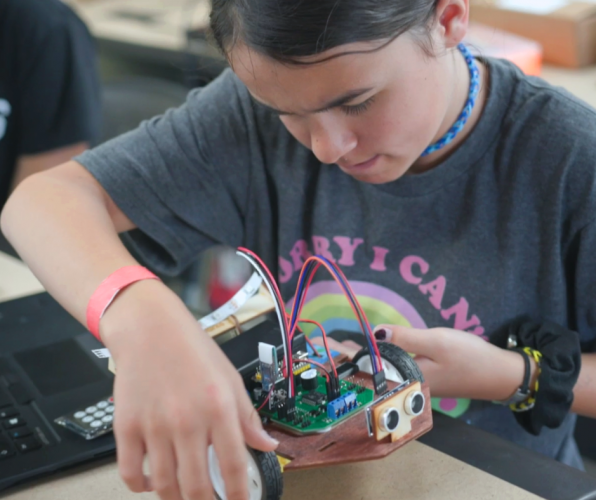
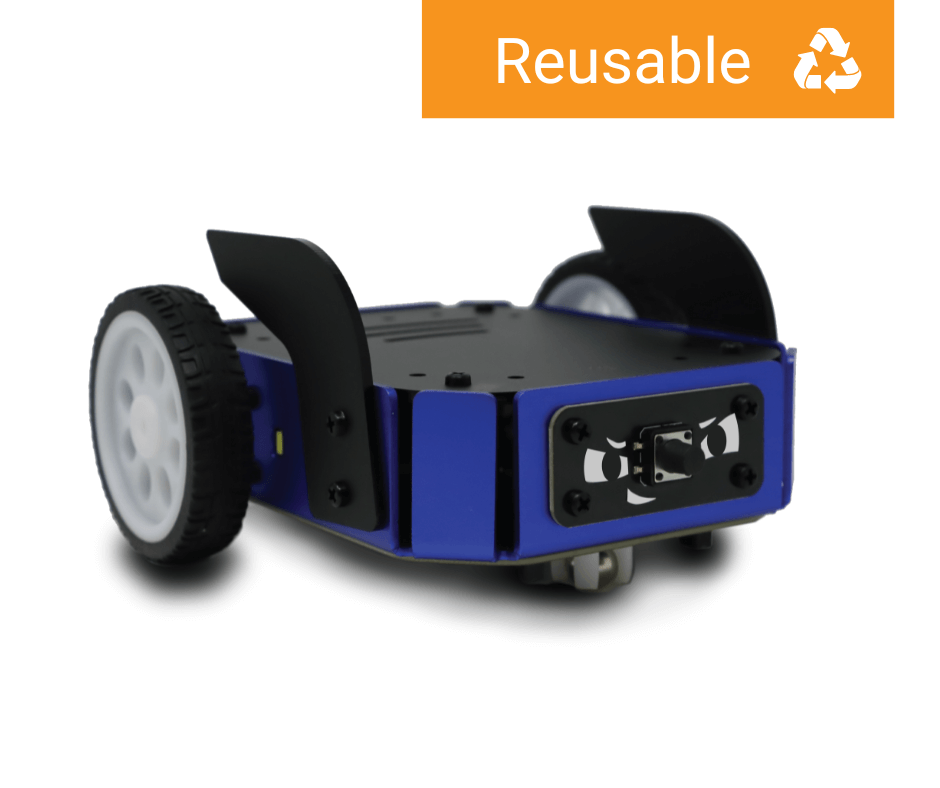
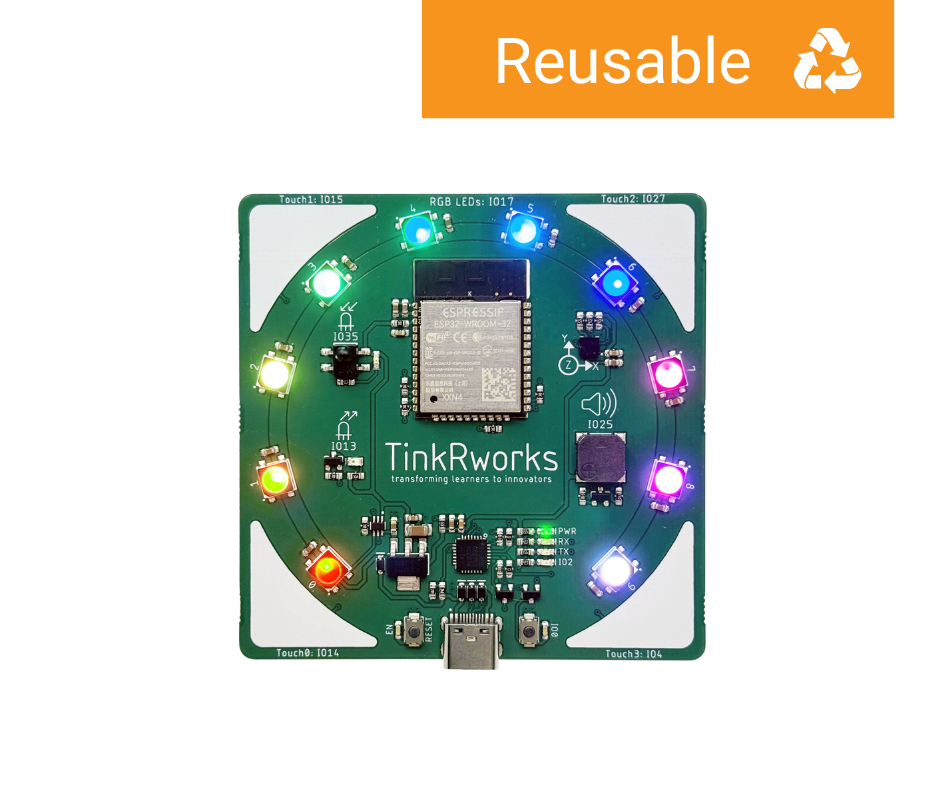
TINKRBOT SCOUT
Grades 3-5
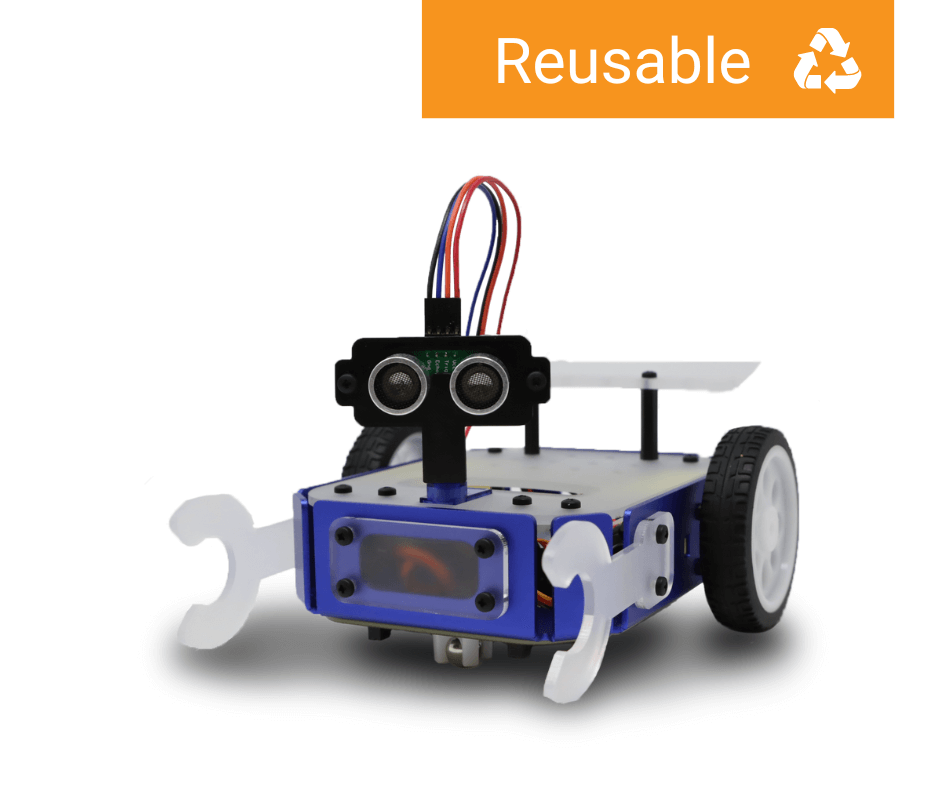
TINKRBOT EXPLORER
Grades 6-8
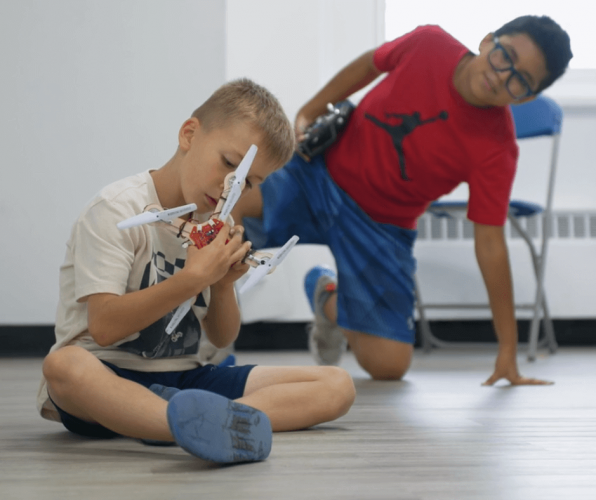
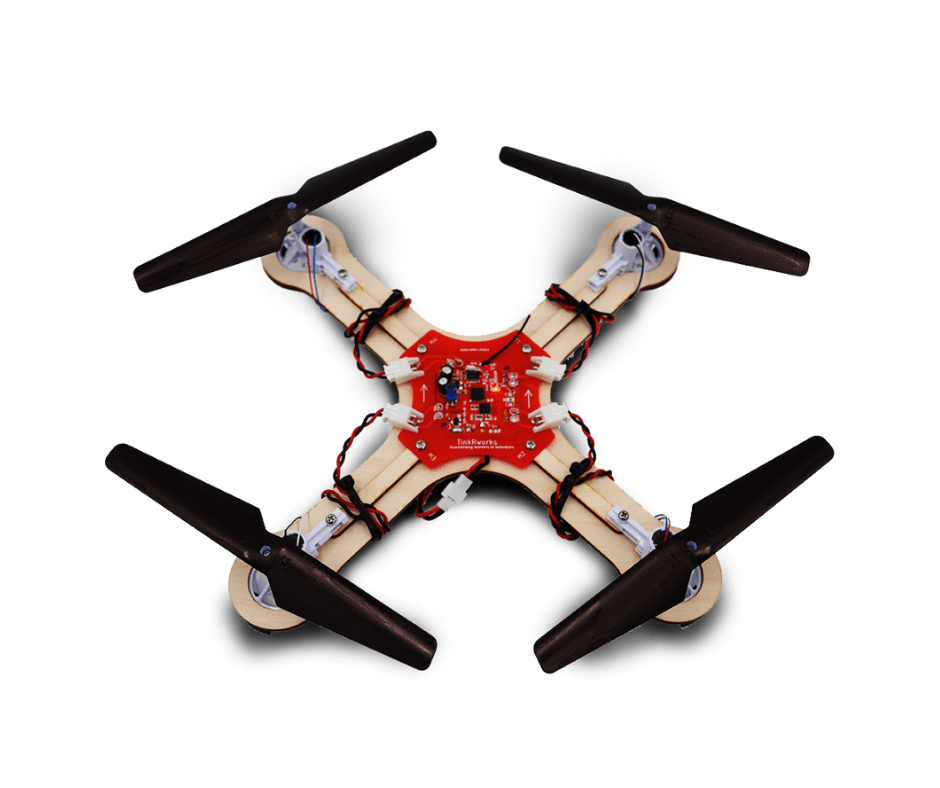
TINKRDRONE
Grades 6-8
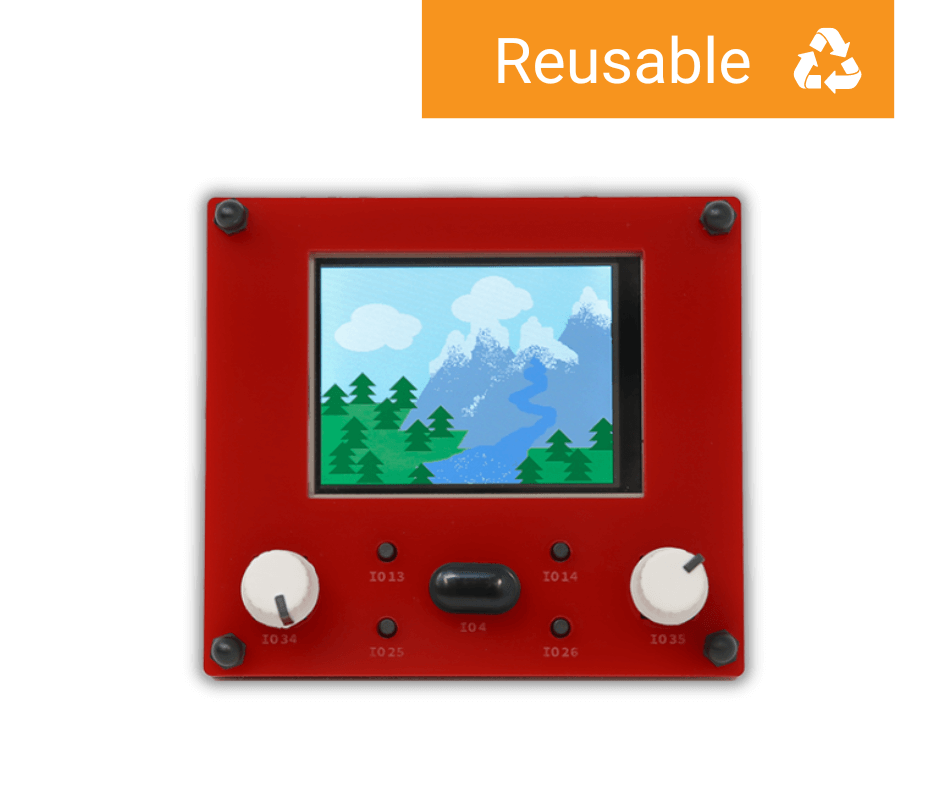
TECH-A-SKETCH
Grades 3-5
LAUNCHPAD
Grades 3-8
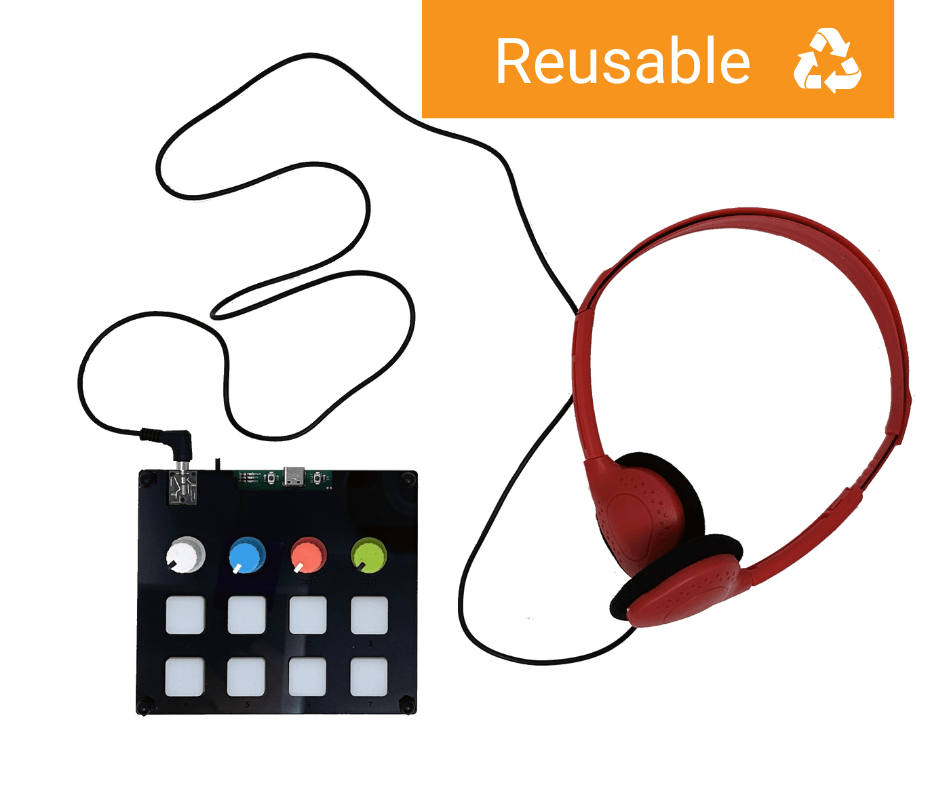
TINKRSYNTH
Grades 6-8
TinkRworks STEAM projects are ready-to-teach and include everything you need to deliver targeted, grade-level standards.
Get a sneak peek at TinkRworks’ supplemental STEAM curriculum with our project lesson samplers.
"TinkRworks is an equalizer in my high poverty district. With more than 50% English learners, our students gravitate to the program because they can engage deeply with the concepts. Students love the hands-on and coding aspects but they’re also developing science vocabulary and communication skills."
“We started using TinkRworks as an enrichment program after school with a small group. The students loved it to so much we now have more than 500 students across the grades using it for 10-15 weeks every year."
"One of the important things to admire about TinkRworks is the collaboration we see between students who would not, under the usual circumstances, get together to solve problems."
Fill out a form, send an email, or give us a call to be connected with a TinkRworks Team Member.
We’re here to help answer your questions about our curriculum, implementation, and pricing.